Read this article with AI
Copy the article text into your chosen tool to inspect its sources and trade-offs.
Trace one event from input to outcome
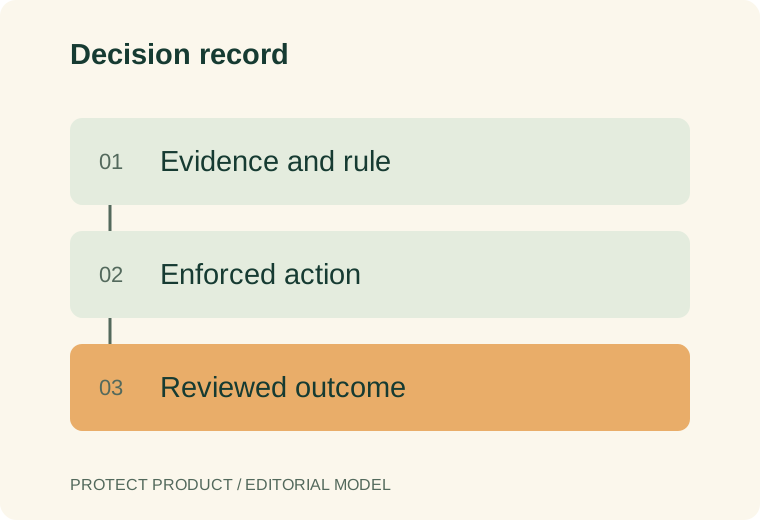
Choose a specific action, such as a signup benefit or payout change. Record which system supplies the evidence, where policy runs, which component applies the result and how the final outcome returns to the case record.
Keep a risk signal separate from a decision. A provider score is one input. “Require verification” is a policy result. “Verification completed” is a later event. Mixing them into one status makes failures difficult to diagnose.
| Layer | Output | Evaluation question |
|---|---|---|
| Collection | Observed event and context | Is the evidence tied to the right action? |
| Enrichment | Provider signals or relationships | What do values and missing states mean? |
| Policy | Allow, hold, verify or deny instruction | Which rule version produced the result? |
| Enforcement | Application state change | Did the protected operation actually wait? |
| Review | Human finding or override | Can the reviewer explain the evidence? |
| Feedback | Confirmed outcome | Is the label mature and trustworthy? |
Public scam trends and operational decision dashboards answer different questions
FTC dashboards provide a free starting point for reported scam trends
The FTC data and visualizations directory links to Explore Data dashboards, annual Consumer Sentinel data books, unwanted-call reporting and datasets. These are useful starting points for free public scam-trend research. Compare the publication date, reporting period, geography and category definitions before placing figures on one chart.
Consumer reports describe what was reported to the contributing system. They do not measure every incident in a population or independently establish each report as confirmed fraud. A rise can reflect changes in reporting as well as changes in the underlying problem. Retain that denominator when explaining a trend.
For a hypothetical product review, use a relevant public trend to form a question, then inspect the product's own account events, losses and resolved cases separately. A public complaint dashboard cannot replace the device, account and payment evidence required for an individual decision. Conversely, a vendor's account-risk dashboard should not be presented as a public index of national scam awareness.
Sources
Continue reading
FAQ
Where can I track public scam trend data for free?
The FTC data directory links to Explore Data dashboards, Consumer Sentinel annual data books and unwanted-call datasets. Keep reporting periods and definitions attached, and describe the figures as reported problems rather than a complete measure of confirmed fraud.
Summarize with AI
Evaluate the workflow under failure
Ask how the platform handles delayed data, unavailable providers, retries and duplicate events. An unknown result should not silently become “safe.” The appropriate fallback depends on the action and the business’s ability to recover.
A hypothetical service receives a risk result after it has already released an expensive compute job. The dashboard can display the warning, but the prevention point was missed. The AI trial controls guide shows why authorization and resource release need a coherent sequence.
For a general event contract, see fraud detection APIs. Ask vendors to demonstrate failure behavior in a controlled integration, not only a successful console walkthrough.
Make rule changes traceable
Store the policy version, reason and effective time with the decision. Restrict who can edit or approve high-impact rules, following the organization’s operating process. Keep overrides distinguishable from automated outcomes.
Test a proposed rule on a reviewed sample before applying it broadly. A historical replay can help assess how the rule would classify known events, but it cannot fully reproduce future user behavior or every missing signal. Label that limitation in the result.
OWASP’s Logging Cheat Sheet provides guidance for useful security event records and sensitive-data handling. Retain what investigators need without turning the dashboard into an unrestricted customer-data store.
Put denominators next to charts
Display event definitions, time windows, unknowns and filters alongside rates. “Blocked events” is not a fraud-prevention rate unless confirmed outcomes support that interpretation. A rising review count may reflect a policy change or collection issue.
Show case age and outcome maturity. Pending disputes should not be counted as confirmed losses, and missing labels should not be assigned to the legitimate group by default. The false-positive guide explains why the comparison population matters.
Public threat dashboards serve a different purpose. Broad trend counts may be useful context, but they do not describe your service’s customer population or establish a suitable decision threshold.
Design the review queue around decisions
Give each case an owner, priority, evidence timeline and next action. A reviewer should see the rule that opened the case and what information could change the decision. Track decisions overturned by later evidence.
Keep customer resolution linked to the case. If a review holds a payout or account, support needs the current state and escalation route. A queue that produces alerts without an operating owner adds backlog rather than protection.
Compare the total operating cost
Include event charges, enrichment providers, historical storage, seats, review effort and integration support. Verify which components are included in the offer. A decisioning platform and a device API may use different billing units and require different staffing.
Use the pricing-unit worksheet before comparing quotes. Finish with a pilot that demonstrates one complete decision and its later outcome, with both engineering and operations able to explain the record.
FAQ
Is a fraud dashboard a decision engine?
Not necessarily. Confirm whether it only displays events or also evaluates and delivers enforceable policy results.
Can a historical replay prove future accuracy?
No. It tests a defined historical sample under stated assumptions. Future traffic and available evidence can differ.
What should a useful case record contain?
The relevant event, evidence, rule version, decision, reviewer actions and final outcome, with appropriate access controls.
Sources
Editorial basis: primary-source documentation and a practical evaluation framework. Examples are hypothetical unless explicitly identified otherwise. This article does not report an independent vendor benchmark.
For evaluation standards and corrections, see our methodology and contact page.