
Read this article with AI
Copy the article text into your chosen tool to inspect its sources and trade-offs.
Read the analytics definition before the percentage
Google Analytics defines several user metrics, including total, active, new and returning users. They are not interchangeable labels. A report using active users as its main denominator can differ from one using all users who triggered an event.
Write the metric definition next to the chart. Include the property, dates, relevant filters and identity method. The word “visitor” alone does not check whether a tool is counting browser environments, recognized users, sessions or something else.
Search impressions and clicks belong to a different measurement layer. Search Console describes visibility and interaction in search, not the complete identity history of people using a website.
Do not force the categories into an unsupported partition
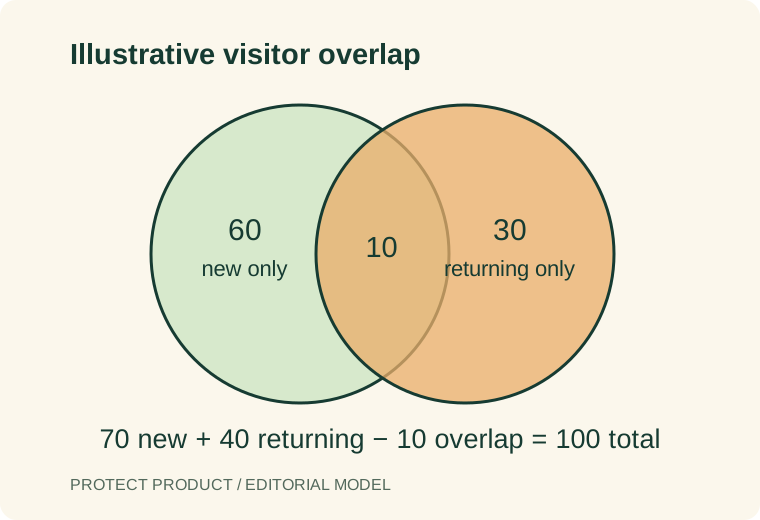
Check whether a person can be new and later return within the same report window. Also check whether the report’s denominator includes the same population as both categories. Do not assume that displayed new and returning metrics must always sum neatly to the same total.
As a hypothetical example, a system could report 100 users, 70 with a first visit during the window and 40 with a return visit, with 10 present in both sets. That example illustrates overlapping sets; it is not a claim about a measured site or a formula for every analytics report.
When a dashboard requires an exclusive split, define the classification rule explicitly. An assigned acquisition cohort and an event-based returning metric can answer different questions.
Choose a benchmark from the business model
| Website purpose | Useful context | Outcome to pair with the visitor mix |
|---|---|---|
| Product acquisition | Campaigns and first meaningful use | Qualified activation |
| Subscription product | Customer lifecycle and access frequency | Continued paid use or retention |
| Ecommerce | Buying cycle and acquisition mix | Completed qualified purchases |
| Documentation or support | Repeat need and existing customers | Successful task completion |
A campaign can bring a wave of genuinely new prospects. An established support portal can naturally attract returning customers. Neither pattern is automatically good or bad without the site’s purpose and outcomes.
Avoid borrowing a ratio from an unrelated sector or a report with a different identity model. A benchmark should state its population, window and measurement method.
Investigate changes in recognition
A customer can appear new when they change devices, browsers or the state available to the analytics system. That is a measurement question as well as a behavior question. Check collection changes and identity joins before announcing an acquisition or retention result.
The cookieless identification guide explains the difference between recognizing an environment and linking an authenticated account. A more aggressive matching policy can also create incorrect joins, so a higher returning count is not automatically more accurate.
For a hypothetical product release, compare the same customer cohort before and after the change. If the collection script stopped running on part of the journey, a changed ratio may reflect coverage rather than a sudden shift in customer loyalty.
Compare cohorts on a stable basis
Use the same observation window, channel definitions and event coverage when comparing periods. Segment where it answers a real question: acquisition source, device surface, product stage or customer group. Do not create many tiny segments and treat random variation as a meaningful ranking.
Pair the visitor mix with qualified outcomes. If many new visitors arrive but few complete the product’s core action, investigate that journey. If returning use grows while paid retention falls, the business needs a different explanation than “returning is good.”
The anonymous personalization guide covers one possible product response. Keep a personalization hypothesis separate from a claim that a visitor’s identity is known.
Build a small reporting checklist
Before sharing a ratio, confirm the user definition, denominator, date range, collection coverage and changes in campaigns or product behavior. Record whether categories overlap. Include at least one downstream business outcome and a note about identity limitations.
Then choose the next investigation. The purpose of the chart is to improve a decision, not to reach an unsupported industry percentage. The fraud dashboard guide applies the same discipline to traffic-quality and risk views.
FAQ
What is a good new-versus-returning visitor ratio?
There is no defensible universal target here. Compare the same business purpose, population, time window and metric definition with relevant outcomes.
Why can a returning customer look new on another device?
The analytics system may recognize environments rather than a complete cross-device account identity. Check the identifier and join method.
Are page views the same as visitors?
No. Page views count a different activity from users or sessions. Read the selected tool’s definition before comparing the numbers.
Sources
Editorial basis: primary-source documentation and a practical evaluation framework. Examples are hypothetical unless explicitly identified otherwise. This article does not report an independent vendor benchmark.
For evaluation standards and corrections, see our methodology and contact page.